Grade 4 (State Board Of Maharashtra)
Chapter : Pictograph
What is pictograph?
Pictograph is one kind of graph in which information is displayed in picture form.
Pictograph use pictures to show data.
Let's check out this pictograph
The above pictograph tells us the number of items available in the bakery.
Number of picture tells the quantity of food items in a bakery.
Cupcakes - 4
Cake - 5
------------------------------------------
Exercises from Page No 85
I
Solution:
Given : Scale - 1 Family means 20 families.
We have to find out the exact number of families.
1) Medicine : Number of pictures = 3
Total number of Families= 3 x 20 = 60
2) Food Items : Number Of Picture = 4
Total number of families = 4 x 20 = 80
3) Clothes : Number of pictures = 2
Total number of families = 2 x 20 = 40
4) Others : Number of pictures = 3
Total number of families = 3 x 20 = 60
Let's solve the questions ,
Q. 1) In all how many families gave help ?
Ans : Medicine + Food Items + Clothes + Others
60 + 80 + 40 + 60 = 240
Q.2) What form of help was given by the largest number of families?
Ans : Largest Number of Families : Food Items: 80
Q.3) What form of aid was given by the least number of families?
Ans : Least Number of families : Clothes = 40
------------------------------------------
II
Solution:
Given Scale = 1 picture of House 🏠 means 10 houses
First we calculate the numbers
Gas = Number of pictures = 4 x 10 = 40
Kerosene = Number of pictures = 7 x 10 = 70
Wood = Number of pictures = 2 x 10 = 20
Gobar Gas = Number of pictures = 3 x 10 = 30
Solve the questions:
Q.1) What kind of fuel used in most houses?
Ans = The biggest number is 70
Kerosene is used in the most houses.
Q.2) How many houses use Gobar Gas ?
Ans = 30 houses use Gobar Gas.
Q.3) How many houses use gas?
Ans = 40 houses use gas.
------------------------------------------
III
Solution:
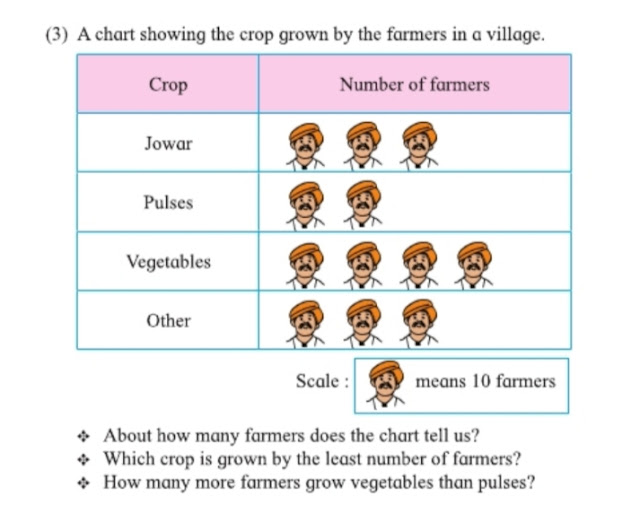
Scale given : 1 picture of farmers means 10 farmers.
Let's calculate the numbers:
Jowar : Number of pictures = 3 x 10 = 30
Pulses : Number of pictures = 2 x 10 = 20
Vegetable : Number of pictures = 4 x 10 = 40
Others : Number of pictures = 3 x 10 = 30
Solve the Questions :
Q 1) About how many farmers does the chart tell us.
Ans : Total number of farmers are =
30 + 20 + 40 + 30 = 120
Q2) Which crop is grown by the least number of farmers?
Ans : The least mean lowest number of farmers is 20
Pulses crop is grown by the least number of farmers.
Q3) How many more farmers grow vegetables than pulses?
Ans : Number of farmers grow vegetables=40
Number of farmers grow pulses = 20
How many more = 40 - 20 = 20
20 more farmers grow vegetables than pulses.
-----------------------------------------
III
Solution:
Given Scale : 1 picture of child means 5 children
Let's calculate the number of childrens
Red : Number of pictures = 3 x 5 =15
Blue : Number of pictures = 1 x 5 = 5
Green : Number of pictures = 2 x 5 = 10
Yellow : Number of pictures = 1 x 5 = 5
Solve the Questions :
Q.1) How many children are there in class ?
Ans : Total number of children :
15 + 5 + 10 + 5 = 35
Q.2) How many children wore yellow clothes?
Ans : Number of yellow clothes are = 5
Q.3) What colour did the greatest number of children wear? How many wore that colour?
Ans : The greatest number of colours worn by children = Red
How many wore that colour = The number of children wore red are = 15
------------------xx---------------xx----
Connect with me on Instagram
Disclaimer : This is purely for helping students and parents. I am a teacher and my intention to help the students.


No comments:
Post a Comment